Jefferson county vaccination rates by zip code: how are JCPS schools impacted?
August 22, 2021
On May 10, 2021, the FDA authorized the emergency use of the Pfizer-BioNTech vaccine against the novel COVID-19 virus for children 12 to 15 years old, thereby allowing all students in high school along with seventh and eighth-grade students to become fully vaccinated. This coincided with JCPS’ resumption of school with an optional hybrid schedule.
This approval helped increase the vaccination rates in Jefferson county and continued to increase into the summer. However, now that students are back in school full time and no longer on a hybrid schedule, vaccination rates have steadied while COVID-19 cases have risen significantly.
Hospitals once again have few empty beds to compete against the ever-growing number of cases, especially with the new Delta variant that is two times more contagious than other strands according to the CDC. These increased cases have also seen a jump in the number of children hospitalized in Norton Children’s Hospital.
With only 30% of kids ages 12 and older in Kentucky having taken at least one dose of the vaccine, students, staff and family have much to consider as their students return to their classes in-person where transmissibility is far more likely to increase.
On August 10, Governor Andy Beshear issued a mask mandate for all Kentucky schools, both public and private. Yet, some school districts ignored the mandate, leaving the decision up to the student’s parents. Decisions regarding mask mandates have become heavily politicized and as of Friday, August 20, private schools are no longer bound by the mask mandates issued by Governor Beshear. Public schools must still abide by the mask mandate, since the Kentucky Department of Education approved it for grades K-12.
This ruling, however, does not change the cross tie in opinions regarding masks and vaccines in JCPS schools. In Jefferson County, 51.2 percent of individuals are fully vaccinated and 59 percent of people have received at least one dose. JCPS schools represent 150 schools, making them the 29th largest district in the country. This means a large population of students are vulnerable to the spread of the virus, especially since vaccinated individuals can be carriers of the new strand.
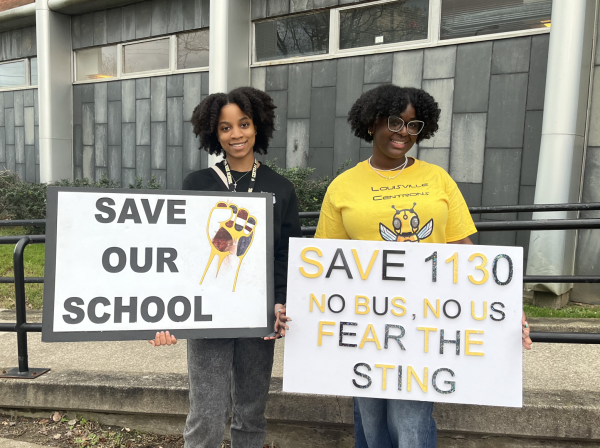
One Manual student, Shridha Rajeswar (12, MST), expressed that she feels more confident being back in-person now that the county vaccination rates are a little over half; although, she is still worried about the higher transmission of the new virus strand. Along with that, the enforcement of social distancing guidelines is also of concern: “[S]ocial distancing guidelines are not being followed and it’s hard to follow them because of the way our school’s infrastructure is organized,” Rajeswar said.
School infrastructure isn’t the only dilemma JCPS schools must work around, but also the rate of COVID-19 cases and vaccination rates of each of the zip codes their students reside in. School administrators have no control over these factors but still must work around them in order to ensure the safety of their students.
The first consideration is the rate of COVID-19 cases in each individual zip code in comparison to the rate of vaccination. As it is seen in the table below, these two factors are largely distributed among the various zip codes. For example, 40216 has the highest number of cases for the week of August 8, and their rate of vaccination is significantly lower than other zip codes that have fewer cases. This same zip code also accounts for the most high school students in JCPS. The table below provides the number of COVID-19 cases for each zip code for the week of August 8 measured on the 2019 Census Bureau population.
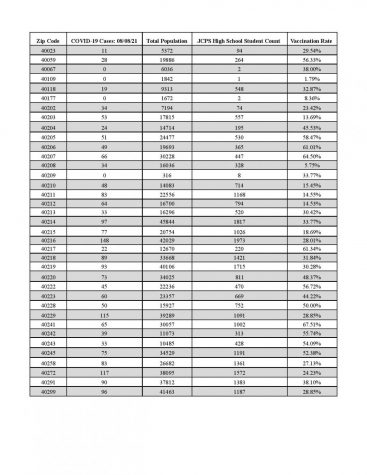
The second table shows a more detailed analysis for each individual high school while also comparing vaccination rates. It is important to note that the number of students recorded represent JCPS’s 2019-20 zip code data and may not be representative of differences in population count now.
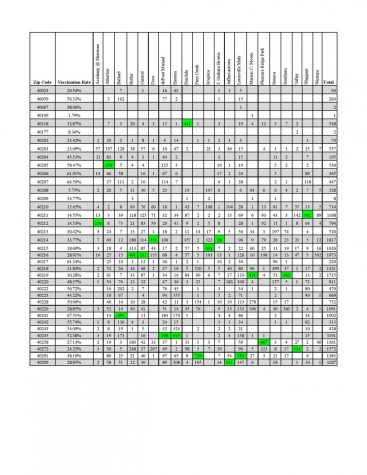
One trend that stands out is zip codes with lower incomes have higher rates of COVID-19 cases but are also more hesitant to get vaccinated, while the zip codes that have higher median incomes have the highest vaccination rates with lower COVID-19 cases.